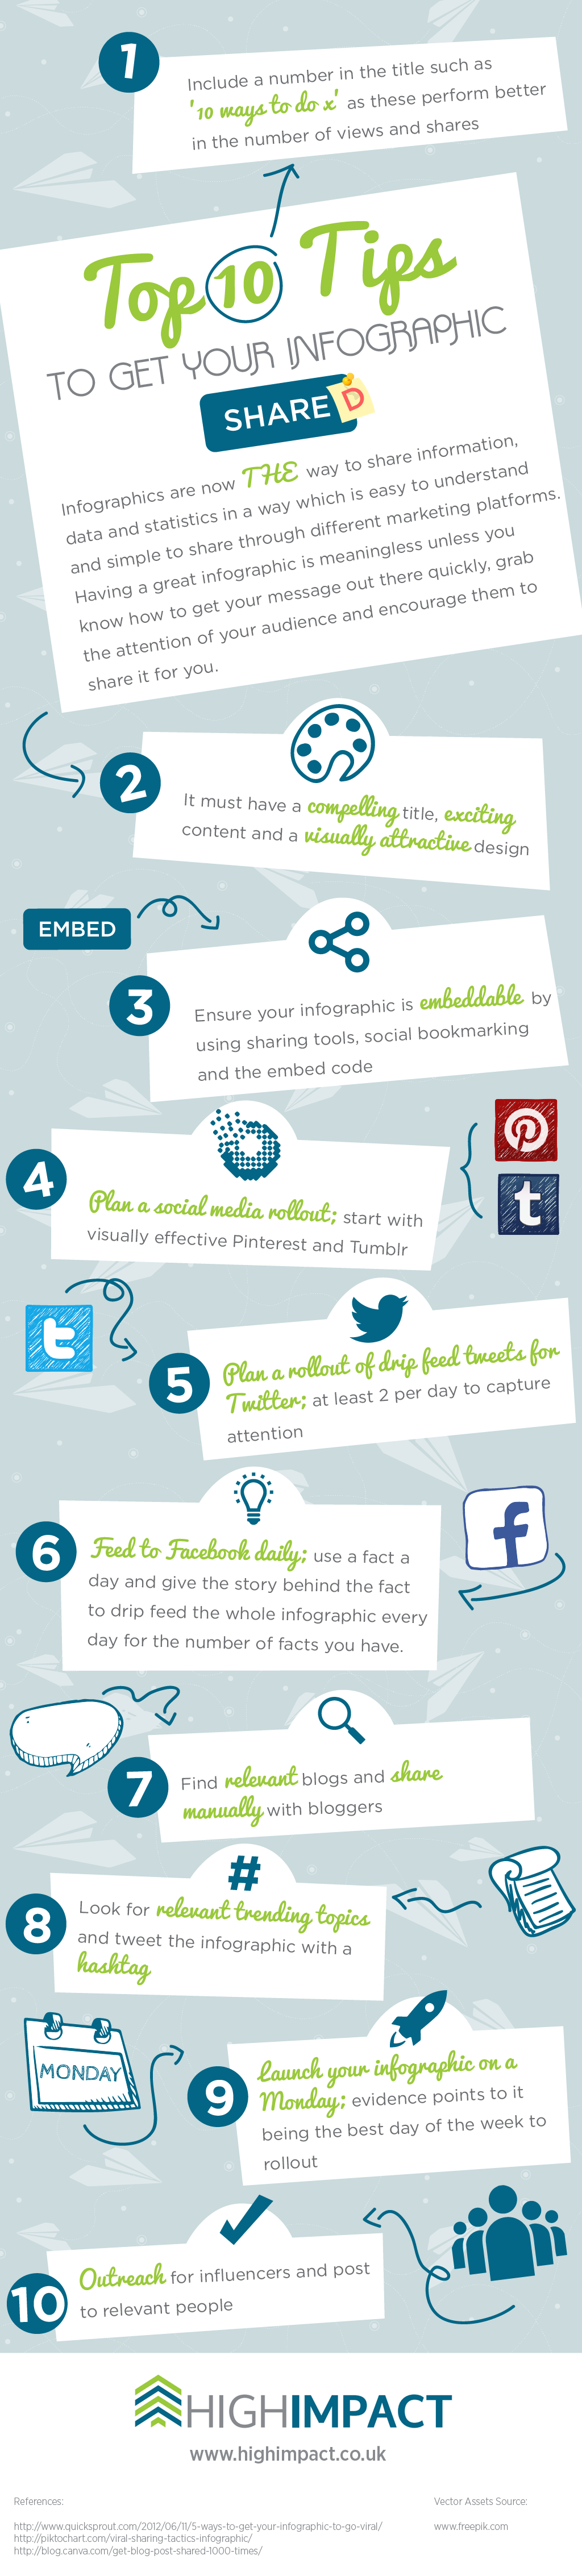
Top 10 tips for getting your infographic shared
There’s no great mystery as to how to get your infographic to go viral; it’s about excellent planning, comprehensive strategising and adding these elements to a fantastic looking infographic.
Infographics are used across the internet as a powerful tool for marketing; there are a number of platforms and applications which can be used to help go that extra mile.
Having an infographic which really looks the business though isn’t enough – it won’t go viral on its own, so you will have to do a great deal of work yourself to launch and accelerate the campaign and to encourage others to publicise it for you.
With the huge numbers of infographics now available on every subject, it’s about being savvy with how to put yourself in the best position possible to get your infographic noticed.
Share this Image On Your Site
Include a number in the title
Whatever other areas of marketing you are planning to aim your infographic at; social media, email or through search engine enquiries, it’s always the title which is the first thing seen. The title is just a click away – or not – from your well-crafted content and it needs to be easy to understand, grab attention and stand out from any similar information available from other websites.
Using a number in a title gives it a defined structure. The reader knows exactly what they are getting before they open it; it’s a firm indication that they don’t have to wade through a great deal of information or data to find out what they need to know. It is going to be 8 tips about a certain subject, 10 about another, 12 about something else. Before even clicking on the link they know roughly how much time they will need to spend reading your infographic and in a busy lifestyle – time is paramount. Using a vague title such as ‘information about x’ could mean anything, change that to ’10 great ideas for x’ gives specific and relevant information.
Title, content, design
It’s important to get the title of the infographic right as it’s the only chance you get to persuade the user to click on your link rather than any others. It has to be catchy, don’t settle for the first one you think of, come up with several before deciding which one will catch the attention of your audience. The whole point of an infographic is that it is an easy way to digest large chunks of information, but the headline chosen will either say it all for you or say nothing for you.
Infographic content must be
- Exciting
- Relevant
- Accessible
Infographic s exist to produce a visual version of a much larger piece of often statistical or data-heavy content. It’s a way in which readers can take in important points quickly and that they are easy to understand. You want your infographic to stand out and so your content needs to hook your visitors as soon as they start to read it.
With only seconds to impress a new visitor to your website, you need to have the full armoury ready to keep them reading. Engage them for 30 seconds and they will continue to click on your links. Add in the fact that excellent content converts to 94% more clicks and is 50 times more likely to be shared than pure text, you can really understand how important what you say on your infographic actually is.
The design of an infographic will either enlighten or confuse the reader. After taking time to research your content, the last thing you want is for it to be lost within a poorly designed visual as it defeats the whole object of presenting easy to understand data.
The design should tick the right boxes in:
- Data; the content you have should tell a story; random information isn’t an infographic
- Colour; choose a colour which fits the theme and the story of the infographic and build the palette from there. It also needs to be pleasing to the eye so ensure it will appeal to as many people as possible in its overall style
- Flow; guide the reader through your story with a conclusion at the end. There should be some kind of order to the visual so it feels like reading a book from the beginning to end rather than having to jump backwards and forwards through chapters
- Visualisation; the visualisation should fit the theme of the infographic and don’t bury the data in the design. Keep your design unique and steer clear of stock illustrations
- Sources; your infographic needs credibility so always include links to the sources of the information. Keep a note of your sources as you gather the data otherwise you won’t remember where it all came from
- Branding; adding company branding can cause challenges when it comes to colour choice of the infographic however to drive traffic and awareness, it’s crucial to include a logo, tagline and a website URL
Use embedding tools and code
Using embedding codes when you publish your infographic means that others can in turn quickly and easily publish it on their own site. All that is required is the correctly written code with the correct attribution to link back your own site and you are pushing your infographic and its messages out to reach thousands or in the most successful situations millions of potential viewers. Not using embedding codes means a hugely wasted opportunity for enormous potential exposure.
Social media rollout
Once you have your completed infographic, you’ll need a robust social media strategy to ensure that it reaches all corners of the internet.
Social media spend is set to double over the next 5 years which shows the importance of a comprehensive strategy.
The place to start is Pinterest as it has become the social media centre of all things visual. Pinterest is now the third most popular social network site, it is retaining users up to three times as effectively as Twitter has ever achieved and those referred to a site from an infographic on Pinterest spend 10% more than from any other referral route.
For word of mouth through the world of microblogging, there are now over 33 million Tumblr users who create 38,000 posts per minute. It supports 8 languages so you know that your infographic will be understood wherever it is shared across the world. Almost half the shared posts on Tumblr are images so this is the place to look for fast word of mouth exposure.
Drip feed Twitter tweets
The secret to Twitter is to keep people interested. It’s a fast moving sound bite based communication tool and it’s about keeping your followers up to date before they move to find other information elsewhere. Twitter users like tweets which are quirky, relevant, funny and easy to understand.
To make the best use of this platform, use each point of your infographic as an individual tweet. Post twice a day with each one linking back to the infographic itself. If you have 20 facts, you have 20 tweets and a total of 10 days of scheduled information sharing. When you get to the end of your 20 facts, start at the beginning again – it’s about embedding the information in the mind of the user; you need to remember that they are taking in huge amounts of information every day and only that which really catches their eye or repeats the message (but in a different way as many times as possible) will stick and lead to the viewer wanting to find out more.
Daily dose of Facebook news
The pace of Facebook is not as fervent as Twitter and so you don’t need to be posting more than once a day. Remember that every time you post, it goes on a Wall and you don’t want to turn off your readers by clogging up their Timeline. Use the same tactic as Twitter; one infographic fact at a time but with this platform, post once a day. You could also include a small amount of extra information with each point to flesh out the data but keep it concise and compelling, don’t undo all the good work of your infographic by then adding huge amounts of text each day; try combining it with a relevant video perhaps. As with Twitter, once you’ve covered all the points, start again.
Blogging
Manually looking for blogs who will be interested in your infographic is going to take some of your time up for a few days, but it will be worth it. Use a tool such as Google Blog Search and look for blogs which create content about subjects which are relevant to your infographic. Put a list together and send each one an email to tell them about your infographic and that they can share with their own readers through it being embedded into the blog and also through tweeting to their followers.
Trending topics and hashtags
When you are writing content for and designing your infographic, it’s a good idea to use a topic your target market will want to know more about and so choosing a trending topic is going to be the way to really increase your visitor numbers. We live in a world now where we all want to know information and statistics about what is happening around us so we can feel knowledgeable and to then be seen as the one to be sharing this on.
Hashtags are a very powerful tool in digital marketing and as long as they are used to their best advantage can create higher instances of engagement, being able to track online presence and be a marker of being a reputable figure within your industry.
You need to know though how to use the hashtag as just adding it to a post doesn’t help. Ensure hashtags are concise and not overly long, conversational and also unique.
Benefits of a hashtag:
- Increased number of followers
- A way to connect with new customers
- Spreads the brand message
- A tool to become a part of conversations and give an opinion
Monday, Monday
Monday morning has always been the traditional time and day to release important news. It’s when the business world awakens for the week, students get together for study and the nation looks to find out what is happening in the world after the relaxing break of the weekend.
In pre-internet days, the most important industry news was always reported at 8am or 9am on a Monday morning because of the timing coinciding with people on their way to start their working week and this tradition has carried on to the best time to release new and exciting data such as an infographic.
In our world now of fast moving news and the need for constant sound bites, Monday morning is when blogs get their highest traffic – the lowest is Saturday, so whilst some may feel it’s best to launch when there’s less news around, it also means it is reaching fewer readers and will then be lost in the Monday morning fresh content. It’s also the optimum time to reach the business influencers of Linkedin where 1 in 27 people in the world are members.
Outreach
Manual outreach is another part of the strategy which will take some time but ultimately will pay off.
Whilst many people don’t blog, most people now have a Twitter account so use their search feature for specific keywords relating to your infographic. Direct message each user and include your infographic and ask for them to share. Some will some won’t but the numbers all add up.
For those bloggers you reach, entice them to act quickly in their sharing of your infographic in that you can tell them that they will be amongst the first to see and share. Those who are amongst the originators find that they become part of the campaign which leads to increased traffic to their own site.
Look for the influencers; those who have large followings on social platforms and send your infographic to them. If you can persuade them to share you are instantly reaching large numbers of people who have established trust, respect and loyalty to the influencer and in turn are more likely to share it on themselves because of its source.
Join industry relevant forums and share through postings – again look for influencers in relevant groups and send directly to them.
LinkedIn is the ideal place for industry specialist posts and discussions; posts including text result in a 98% higher rate of comments and 50% of the 259 million members are more likely to buy from companies they have engaged with using LinkedIn.
Let’s go viral
Infographics are a fun way to present and learn about subjects, statistics and otherwise possibly dull or information heavy topics. This is why they are currently so popular – we don’t have the time anymore to sit and read dull data and so creating an attractive and relatable piece of design which is proven to be well researched is how an infographic – along with a well-executed battle plan – goes viral.
Author: Anthony Biggs is the Digital Marketing Manager for High Impact.
You can find him on Google + here.